matrix movie machine screen animation
This was a project for fun and distraction with
gganimate.
First we need to load the required R packages.
- Obviously we need
gganimate(which actually also loadsggplot2). - We use the
reshape2package to convert our data from short to long format. - We need the
gifskipackage to render aggplot2object to an animated gif file.
testing some ideas
data <- data.frame(X=c(0,1), Y=c(0,1))

downstr <- c("石","ϗ","Ϸ","ζ","ϡ","ϟ","ξ","Ψ","ϵ","Ͽ",
             "火","☳","☨","☢","☣","☊","☌","ʆ","ʡ","ʭ",
             "∂","元","円","㍐","₰","₹","€","¥")
# plot(1:length(downstr),1:length(downstr), type="n")
# text(1:length(downstr),rep(12,length(downstr)),labels=downstr)
ht <- sample(3:20,1)
ggplot(data) +
  geom_point(aes(X, Y)) +
  annotate("text", x=rep(sample(seq(0,1,0.05),1),ht),
           y=seq(1.2,1.2-(0.05*(ht-1)),-0.05),
           label = paste0(sample(downstr, ht, replace=F)),
           vjust = 1, col="#d0fff8", size=3.5) +
  theme_minimal() +
  theme(plot.background = element_rect(fill="black"),
        panel.grid = element_line(color="transparent"),
        axis.text = element_text(color="transparent"))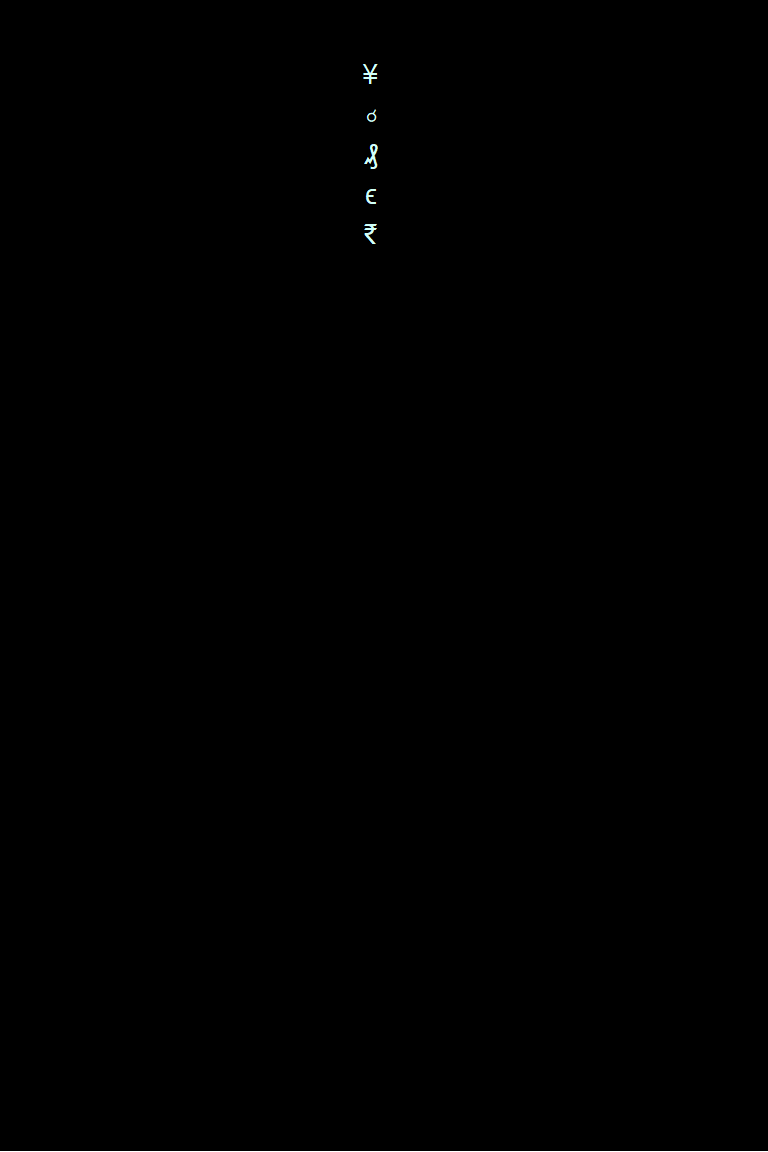
Plot to show our simulated dataset.
Make some data based on this simple test
## manually make melted data not using reshape::melt ####
for(j in 1:15){
  md <- data.frame(t = as.integer(rep(NA,400)),
                   x = rep(sample(seq(0,1,0.02),1), 20*20),
                   y = as.integer(rep(NA,400)),
                   lbl = rep(sample(downstr,20, replace = F), 20))
  y0 <- sample(seq(1,2,0.05),1)
  for(i in 1:20){
           md$t[(20*i-19):(20*i)] <- rep(i,20)
           md$y[(20*i-19):(20*i)] <- seq(y0-(0.05*(i-1)),(y0-0.95)-(0.05*(i-1)),l=20)
           }
  md$t <- as.factor(md$t)
  assign(paste0("mxd",str_pad(j,2,"left","0")), md)
  }
flist <- ls(patt="mxd")
mxdAll <- data.frame(t = as.integer(NULL), x = as.numeric(NULL),
                    y = as.numeric(NULL), lbl = as.character(NULL))
for(i in 1:length(flist)){
  mxdAll <- rbind(mxdAll, get(flist[i]))
}
str(mxdAll)
## 'data.frame': 12000 obs. of 4 variables:
## $ t : Factor w/ 20 levels "1","2","3","4",..: 1 1 1 1 1 1 1 1 1 1 ...
## $ x : num 0.8 0.8 0.8 0.8 0.8 0.8 0.8 0.8 0.8 0.8 ...
## $ y : num 1.6 1.55 1.5 1.45 1.4 1.35 1.3 1.25 1.2 1.15 ...
## $ lbl: chr "¥" "ʡ" "☌" "☊" ...The data we have created is already long-form, so we don't need to
use the melt() function in the reshape2
package.
Make the animation
mtrx <- ggplot(mxdAll) +
  geom_text(aes(x=x, y=y, label=lbl, colour=t), show.legend = F,
            vjust=1, size=12, size.unit="pt", fontface=2) +
  scale_x_continuous(limits=c(0,20)) +
  scale_y_continuous(limits=c(0,1)) +
  scale_color_manual(
    values = colorRampPalette(c("limegreen","#a0ffd0"))(20)
    ) +
  theme_minimal() +
  theme(plot.background = element_rect(fill="black"),
        panel.background = element_rect(fill="black"),
        panel.grid = element_line(color="transparent"),
        legend.position="none",
        axis.ticks.x = element_blank(),
        axis.text.x = element_blank(),
        axis.text = element_blank(),
        panel.border = element_rect(colour = 1,fill=NA)) +
  transition_states(dd1.L$t,
                    transition_length = 1,
                    state_length = c(3,rep(0,10),3),
                    wrap = FALSE) +
  enter_fade() +
  exit_fade() +
  shadow_wake(wake_length = 0.15, size = T, colour="#60606040")
Now that we have made a gganimate object, we can save it
as an animated gif file using the anim_save() function from
the gifski package:
require(gifski)
options(gganimate.dev_args = list(width = 600, height = 450))
anim_save("images/mtrxAnim.gif", animate(mtrx, renderer = gifski_renderer(),
                                   duration = 12))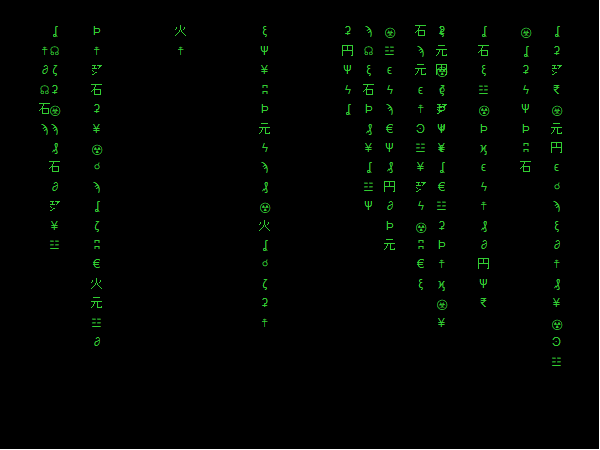
Figure 3. Animation of machine screens from The
Matrix movie made with the gganimate R package.
CC-BY-SA • All content by Ratey-AtUWA. My employer does not necessarily know about or endorse the content of this website.
Created with rmarkdown in RStudio using the cyborg theme from Bootswatch via the bslib package, and fontawesome v5 icons.