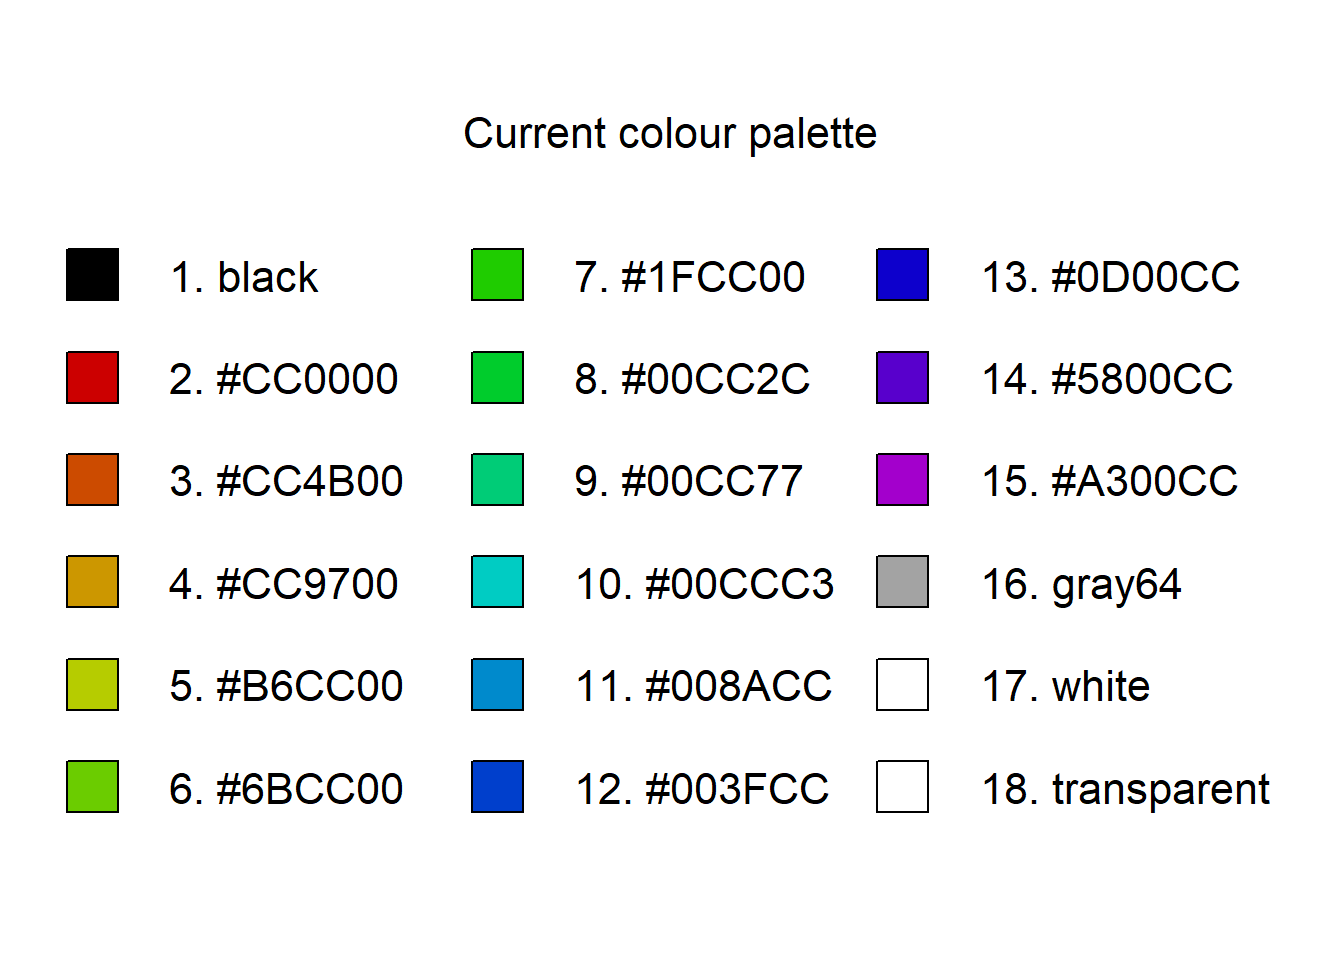
R function to show colour palette
Sometimes it's good to actually see the colour palette in an image rather than as a vector of character strings, especially when those strings are hex codes. Especially if, like me, you tend to change colour palettes depending on what type of plot or map you're making.
The following function uses the legend() function to
display the colour palette with their colour names/strings. It tries to
scale the legend to fit the number of colours in the palette. The only
output is a blank plot showing just the legend.
showpal <- function(
    ncol = 2,
    cex=1.4,
    pt.cex=4
)
  {  lp0 <- length(palette())
  xspac <- pt.cex/5
  yspac <- 2*(pt.cex/5)
  if(lp0>12&ncol==2) {        # trying to fit longer palettes - needs work
    ncol <- ceiling(lp0/6)
    cex <- 24/lp0
    pt.cex <- 72/lp0
    xspac <- pt.cex/2
    yspac <- 1.25*(pt.cex/2.5)
  }
  par(mar=rep(0.5,4))
  plot(c(0,1),c(0,1), type="n", bty="n", ann = F,
       xaxt="n", yaxt="n", xlab="", ylab="")
  legend("center", ncol = ncol, bty = "n",
         legend=paste(paste0(seq(1,length(palette())),"."),
                                        palette()),
         title = "Current colour palette",
         pt.bg = seq(1,length(palette())),
         pch = 22,
         pt.cex = pt.cex,
         cex = cex,
         x.intersp = xspac,
         y.intersp = yspac)
  par(mar = c(4,4,3,1))
}
Using the showpal() function
palette(c("black",rainbow(14, v=0.8, end=0.8),"gray64","white","transparent"))
showpal()
CC-BY-SA • All content by Ratey-AtUWA. My employer does not necessarily know about or endorse the content of this website.
Created with rmarkdown in RStudio using the cyborg theme from Bootswatch via the bslib package, and fontawesome v5 icons.